> ## Documentation Index
> Fetch the complete documentation index at: https://checkly-422f444a-immanuel-fix-api-spec.mintlify.site/llms.txt
> Use this file to discover all available pages before exploring further.
# Traces
> Trace and debug requests and data flowing through your application and identify performance bottlenecks and failures.
 ## What is Distributed Tracing?
Distributed tracing tracks requests as they flow through your application's services and infrastructure. It helps you:
* Understand request flow across services
* Identify performance bottlenecks
* Debug failures and errors
* Optimize application performance
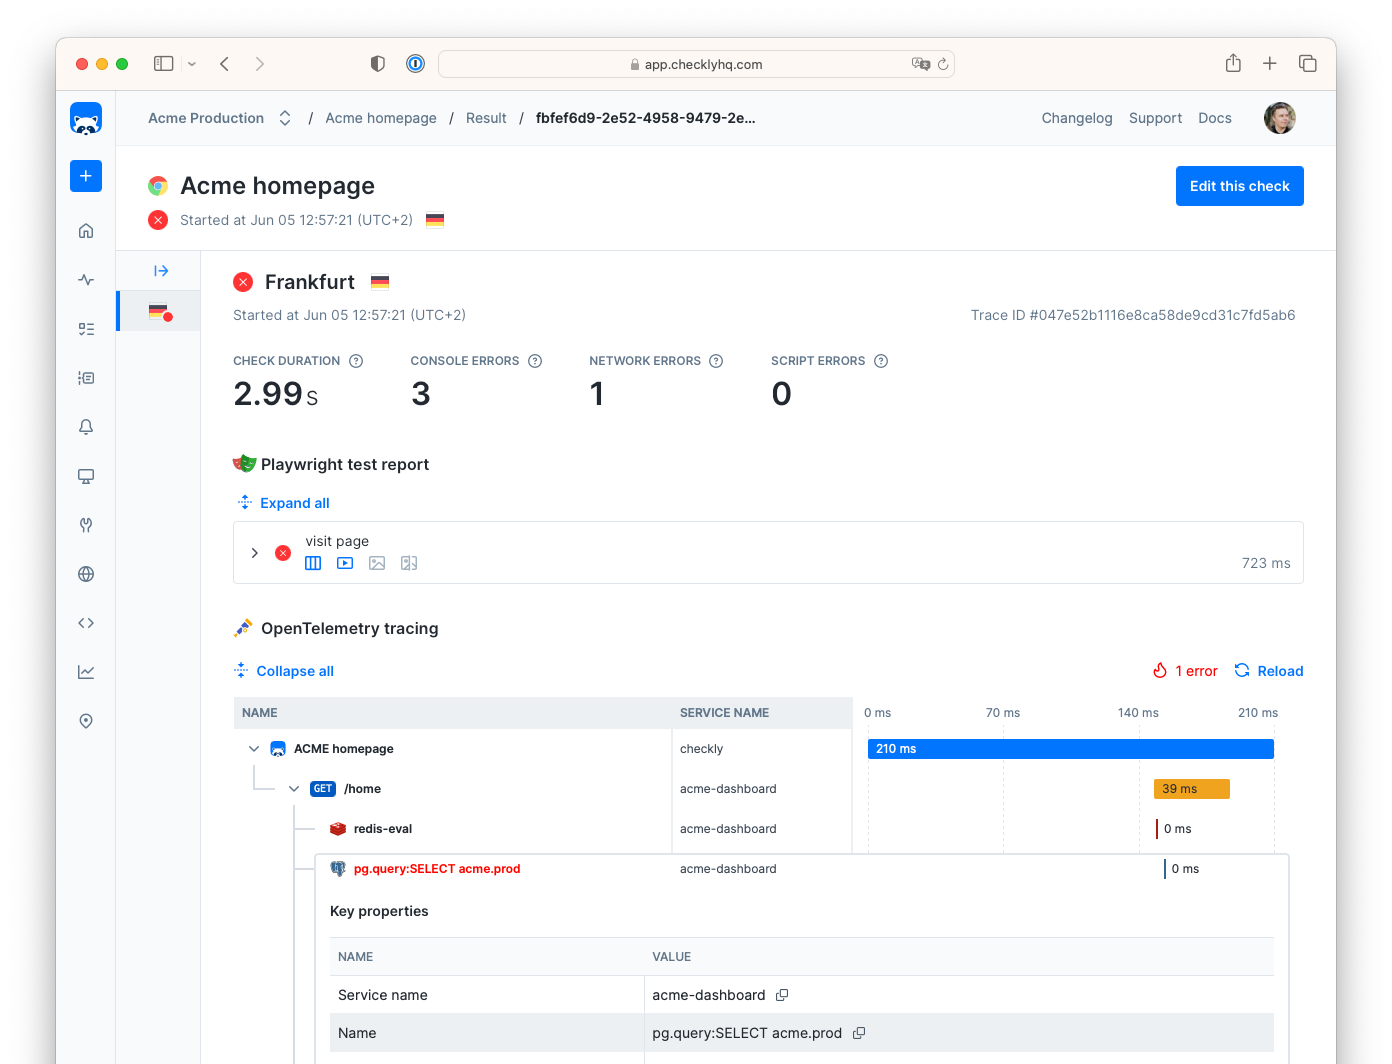
With telemetry traces configured, you will have access to traces in all the places where it matters to more quickly resolve issues:
* **Check results:** resolve production outages faster by correlating failing checks with infrastructure traces.
* **Test sessions:** understand any failures during test session execution.
* **Check editors:** get a live trace while building, editing and debugging check code.
## Getting Started with Checkly Traces
To get started with Checkly Traces using OpenTelemetry, pick the scenario that best fits your needs.
Instrument your app and send traces directly to Checkly. No need for a 3rd party OTel backend.
Send your infrastructure traces to Checkly to get contextualized check failure analysis.
Export check results as traces to your 3rd party OTel tooling
See this in action in the video below:
## Key Benefits
Only traces generated by Checkly checks are forwarded to third-party tools, significantly reducing data transfer costs while maintaining comprehensive monitoring coverage.
Combine synthetic monitoring data with application traces in your existing observability platform for a complete picture of system health.
When checks fail, trace data provides immediate context about what happened in your application stack, accelerating root cause analysis.
Works with existing OpenTelemetry instrumentation and popular observability platforms without requiring changes to your application logic.
## What is Distributed Tracing?
Distributed tracing tracks requests as they flow through your application's services and infrastructure. It helps you:
* Understand request flow across services
* Identify performance bottlenecks
* Debug failures and errors
* Optimize application performance
With telemetry traces configured, you will have access to traces in all the places where it matters to more quickly resolve issues:
* **Check results:** resolve production outages faster by correlating failing checks with infrastructure traces.
* **Test sessions:** understand any failures during test session execution.
* **Check editors:** get a live trace while building, editing and debugging check code.
## Getting Started with Checkly Traces
To get started with Checkly Traces using OpenTelemetry, pick the scenario that best fits your needs.
Instrument your app and send traces directly to Checkly. No need for a 3rd party OTel backend.
Send your infrastructure traces to Checkly to get contextualized check failure analysis.
Export check results as traces to your 3rd party OTel tooling
See this in action in the video below:
## Key Benefits
Only traces generated by Checkly checks are forwarded to third-party tools, significantly reducing data transfer costs while maintaining comprehensive monitoring coverage.
Combine synthetic monitoring data with application traces in your existing observability platform for a complete picture of system health.
When checks fail, trace data provides immediate context about what happened in your application stack, accelerating root cause analysis.
Works with existing OpenTelemetry instrumentation and popular observability platforms without requiring changes to your application logic.